· Scientific articles · 6 minutes
Tea and Near-Infrared Spectroscopy
Sometimes the true origin of tea matters. Modern production technology is easy to replicate, and the appearance, taste, and aroma of famous teas are reproduced in other, non-native regions. Near-infrared spectroscopy offers an objective, instrumental solution to this problem.
Sometimes the true origin of tea matters. Nowadays, production technology is easy to replicate, and the appearance, taste, and aroma of famous teas are reproduced in other regions that are not their “native” ones. Terroir characteristics — climate, soil, biological environment, etc. — cannot, at least for now, be transferred from place to place. Moreover, proper geography is in many cases grounded in proper botany (since for many well-known varieties, the reference sources of raw material are local tea plant cultivars) and precise technology that has been developed and refined over a long time. All of this ultimately affects the properties of tea as well as its price, and it is no coincidence that so much work has recently been devoted to the geographical protection of tea: defining the boundaries of areas where tea may be produced under certain names, using special packaging with QR codes and holograms, and so on.
Even a highly qualified taster may have difficulty distinguishing a Taiwanese oolong from a Vietnamese one (incidentally, four years ago a fraud was uncovered at the Lugu competition, where one of the farmers had imported tea from Vietnam) or Zhengshan Xiaozhong from a stylistically similar red tea produced outside the Tongmu Guan reserve area. Another similar problem is the botanical identification of tea. It is not always possible to determine with certainty what raw material a tea is produced from based on the shape and color of the leaves and the characteristics of taste and aroma. This can be significant, for example, in cases where the cost of tea made from different cultivars varies considerably, as is the case with sheng pu-erhs. Genetic analysis could resolve everything, but despite enormous advances in this field in recent times, it is still too complex, time-consuming, and expensive to become a routine method of control in the tea market.
Finally, even when geography and botany are precisely known, the quality level of tea and its corresponding price are not always easy to establish. Professional tasters are able to accurately rank dozens of tea samples by quality and price in increments of 10–20 yuan per jin (500 g), but an element of randomness in their work cannot be ruled out. The average consumer is in a much more difficult situation — there is no reliable, unified system for labeling quality levels — all those “A,” “AA,” “AAA,” “AAAAA” grades are often incomparable with one another.
However, surprisingly, there is a method that allows one to determine with high accuracy (90% and above) both the geographical and botanical origin of tea, as well as its quality level and price. Quite by coincidence, this method is partially related to my own scientific work, so I am happy to talk about it. The method is entirely objective, instrumental, and reproducible, meaning that human influence is excluded.
Near-infrared spectroscopy (NIR) as a research method is based on studying the absorption and reflection of radiation in the near-infrared range (wavelengths of 780–2526 nm), located between the red band of visible light and the mid-infrared radiation. The first spectroscopes and spectrometers appeared as early as the 19th century, but the development of spectroscopy, and especially NIR spectroscopy, proceeded rather slowly. The most significant improvement in acquiring spectra came with the application of the Fourier transform, which made it possible to obtain spectra much faster.
The most prominent absorption bands in the near-infrared range are produced by bonds of hydrogen with carbon, nitrogen, oxygen, and sulfur, making NIR spectrometry exceptionally valuable for studying organic compounds. It can be used both to determine the organic matter content in a sample and to obtain individual spectra of samples — something like their fingerprints. But while absorption bands in the mid-infrared range are easy to interpret, near-infrared spectra are much more difficult to decipher due to overlapping overtones and combination bands — such bands therefore require more in-depth processing. That is why the possibilities for effective application of NIR spectroscopy have emerged in recent decades alongside the development of computer technology and the improvement of mathematical and statistical methods for analyzing large datasets (known as chemometrics). Let us now turn to the connection between NIR spectroscopy and tea.
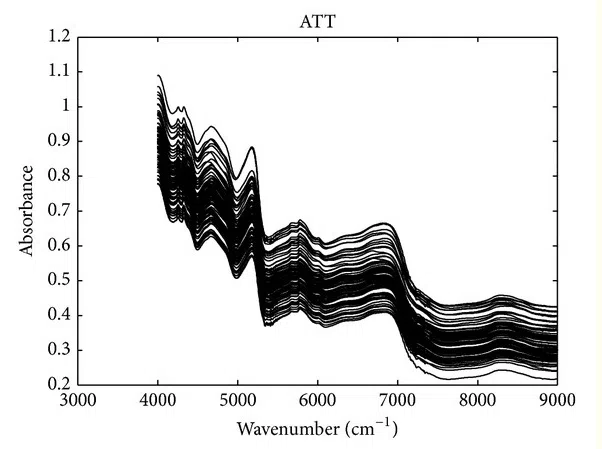
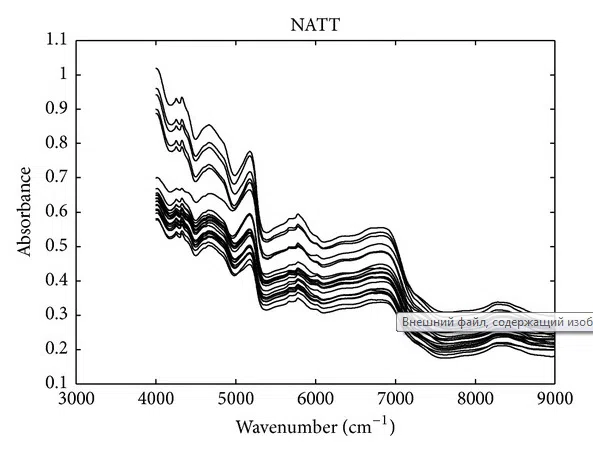
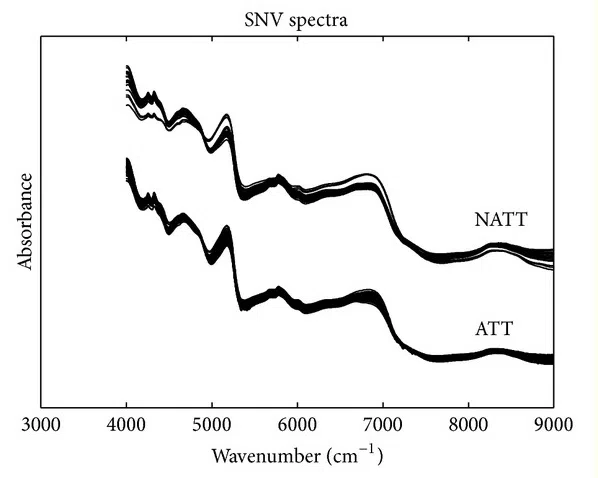
A team of scientists from the Zhejiang Provincial Key Laboratory of Biometrology and Inspection and Quarantine examined 570 samples of Tie Guan Yin tea — 450 from thirty districts in Anxi and 120 from other regions: Yongchun, Huaan, Xiandu, Wuyuan, and Daliangshan (Sichuan) — all teas came from the spring harvest. In their raw state, some of the spectra of TGY from outside Anxi (NATT) were similar to the spectra of TGY from Anxi (ATT), and it was difficult to distinguish them with the naked eye (Fig. 1, 2). Therefore, a multi-step mathematical analysis of the obtained data was carried out using Stahel-Donoho estimation (SDE; at this stage, samples producing spectra with large deviations were excluded, though there were few — 19 ATT and 5 NATT), partial least squares discriminant analysis (PLSDA), standard normal variate transformation (SNV transformation), and other methods.
As a result, clearly distinct spectra were obtained for teas from Anxi and from outside Anxi. The samples were then divided into “training” and “prediction” sets using the Kennard-Stone algorithm. After applying the system calibrated against the “training” set to the “prediction” set, sensitivity reached 93.1% and specificity reached 100%. To put it somewhat simply, after such preliminary calibration, over 90% of new samples can be unambiguously and correctly assigned to the appropriate category. The spectroscopy of a sample takes about one minute, and the mathematical processing of the spectrum takes a few seconds.
In another similar study, the possibilities of distinguishing Huang Jin Gui, Ben Shan Oolong, Mao Xie, and Mei Zhan using NIR spectroscopy were examined. A different set of mathematical tools was employed — principal component analysis (PCA), multiplicative scatter correction (MSC), and others — but the overall study design is similar: samples were divided into a “calibration” set and a “prediction” set, and the accuracy of tea classification in the “prediction” set reached 90%. The same approach can be used to identify, for example, green teas from the provinces of Anhui, Henan, Zhejiang, and Jiangsu — NIR spectroscopy with Fourier transform (FT-NIR) and the principal component method achieved 100% accuracy (!) in determining the geographical origin of samples.
Quality can also be assessed using spectroscopy — Japanese green tea was ranked by quality in a tea competition by scientists from the University of Tokyo using FT-NIR spectroscopy, principal component analysis, and partial least squares regression, also known as projections to latent structures. It turned out that the absorption region of 1800–1925 nm has a high correlation with tea quality.
Sources: [1], [2], [3], [4], [5]
Source: Tea house “Owl and Panda”